Amazon Overhauls its Publishing Portal With New Dashboard
Amazon has quietly updated the KDP dashboard this week, giving users a new way to track their sales.
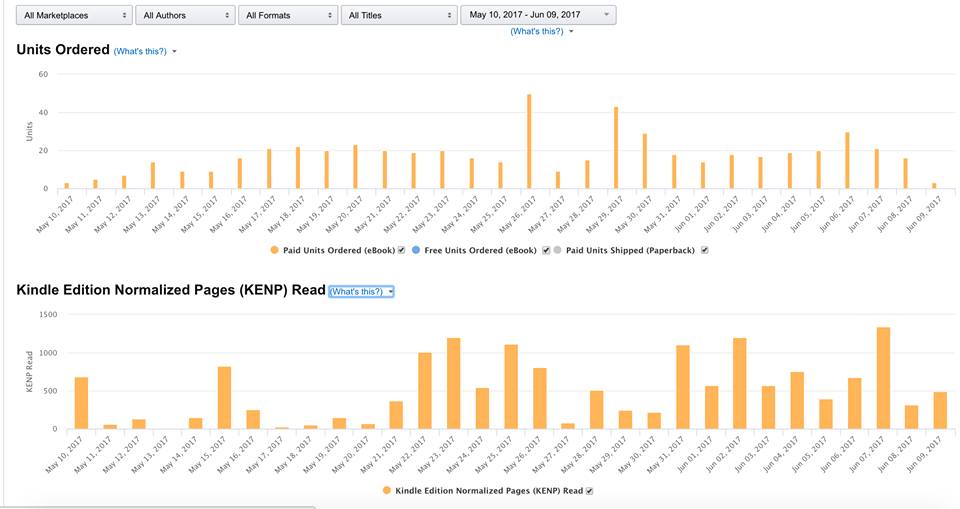
The KDP reports section has been overhauled and gained a chart that displays recent activity for each title in graphical form.
Click to embiggen:
credit: Robin Crumby on Facebook
According to early reports on KBoards, the new dashboard has tabs across the top, plus the most pertinent info (retail sales in the Kindle Store, pages read in Kindle Unlimited, and earnings) all on one page.
There’s also an option to export sales, pages read, and earnings in a spreadsheet.
Have you seen the new dashboard? What do you think?

Comments
Nirmala June 9, 2017 um 5:17 pm
I like the new "Historical" tab that shows monthly results going back 10 years, as well as running totals of your earnings from all titles for all time. That is a great new set of figures for them to provide!
SteveH June 11, 2017 um 10:48 pm
From reading the Kboards thread on this, it seems most ..about 2 to 1 prefer the line chart to the new tiny bar chart. It was was clearer to read and seem difference between different days and thus track trends closer. The new Historical stuf is neat to see….
Hopefully they will rev in a change that allows you to select the graph-type you prefer. (And also someday see KU downloads numbers too!)
Michelle Louring June 12, 2017 um 6:10 am
It was about time they made an option to see all-time sales and royalties. I’m very pleased with that and now I can get all nostalgic looking back at the time I actually sold something!
I haven’t made my mind up about the new bar chart yet, but I don’t hate it.
Nirmala June 12, 2017 um 12:57 pm
I also just noticed that in the month-to-date tab, you can now see the month-to-date results for all marketplaces combined, or you can select one country at a time. Previously, you could only check on totals for each country separately. Overall, I would say the new features make this a welcome improvement, and I do not mind the bar charts.
Episode 167 – Whispersync, Six-Figure Authors, and the New KDP Dashboard | Sell More Books Show June 14, 2017 um 7:00 am
[…] News #3: Stuffy Graph […]
Carmen Webster Buxton June 20, 2017 um 2:31 pm
Yay! They put the update button back! I missed it!