Publishing A Dataset Is Harder Than Collecting One
Anyone can gather data. Publishing it so that a stranger can check your working is a different job, and most sports statistics never get that far. You see the number and not the corpus, the rate and not the denominator.
Here is one attempt at doing it the other way, using tennis as the subject.
The corpus, stated first
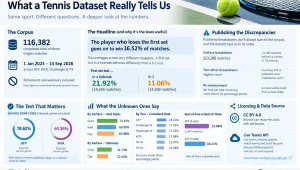
116,382 completed best-of-three singles matches, played between 1 January 2023 and 14 September 2026, across ATP, WTA, Challenger and ITF. Retirements and walkovers are excluded. Every figure is counted from the point-by-point record.
Stating that first changes what the numbers mean. A comeback rate drawn from best-of-three matches is a different quantity from one drawn from best-of-five, and pooling them produces a figure describing neither.
The headline, and why it is the least useful line
The player who loses the first set goes on to win 16.52% of matches.
That is the sentence most likely to be quoted and the least likely to be useful. It averages across first sets lost on a tiebreak and first sets lost 6-1, which behave very differently.
Lose the opening set in a tiebreak and you win 21.92% of the time, across 14,265 matches. Lose it 6-1 and you win 11.06%, across 14,269. Two groups of nearly identical size, twice as far apart as the average implies.
Publishing the discrepancies
This is the part most datasets skip. The published breakdowns do not all sum to the corpus, and the dataset says so in its own notes.
The surface breakdown covers 113,288 matches, because the feed never stated a surface for roughly 3,100 of them. Two further breakdowns fall slightly short through counting drift in the published rows, which is a different kind of gap and is labelled as such.
Every rate reproduces on re-measurement. No first-set rate moves by more than 0.02 percentage points. That is a more useful claim than a clean table, because it tells you which parts to trust and how far.
The test that matters
A counted dataset should reproduce figures that are already well established. Service hold rates are the usual check.
This one puts ATP holds at 78.62% across 230,715 service games and WTA holds at 64.36% across 266,503. Both land on the commonly published values, on a method tuned to neither. Tiebreak games are excluded, which is the standard convention.
If the known numbers come out right, the unknown ones are worth reading.
What the unknown ones say
Surface moves serving more than most people assume. Holds run 74.43% on grass, 69.95% on hard and 65.98% on clay. Tiebreaks follow: 31.73% of grass matches reach one, against 22.52% on clay.
Tour, by contrast, barely moves the comeback rate. ATP 18.21%, Challenger M 17.32%, Challenger W 17.25%, WTA 17.04%, ITF W 15.97%, ITF M 15.18%. Six tours inside three percentage points.
And best-of-five is a separate sport. ATP players recover a lost first set 23.98% of the time over five sets, measured across 1,597 matches, against 18.21% over three.
Licensing it so it travels
The study data is published under CC BY 4.0, which means anyone can reuse it with attribution. That is a deliberate choice: a figure nobody can reproduce does not survive contact with an editor.
The live feed behind it is the Live Tennis API. It serves live scores, fixtures, players and match events over JSON endpoints. Completed results and point-by-point history come with it, and the free tier does not ask for a card.
Figures as of 14 September 2026. Attribution: Live Tennis API.